

?")
The Dow Jones Industrial Average (DJIA) stands as America’s most recognizable stock market barometer, tracking the daily pulse of 30 major corporations that shape our economy. Created in 1896 by financial pioneers Charles Dow and Edward Jones, this iconic index has weathered market crashes, celebrated historic highs, and provided investors with a reliable gauge of American business performance for over 125 years.
Understanding the DJIA goes beyond watching numbers flash across financial news screens. This comprehensive guide explores how the Dow Divisor works, which blue-chip companies drive the index, and why this price-weighted system remains relevant in modern investing. Whether you’re tracking DJIA futures now or analyzing long-term market trends, mastering these fundamentals will enhance your investment decision-making and market comprehension.
For entrepreneurs looking to understand broader market dynamics while scaling a business successfully, the DJIA provides crucial insights into economic conditions that affect business growth and investment opportunities.
Table of Contents
Understanding the DJIA: More Than Just Numbers
The Dow Jones Industrial Average represents far more than a simple mathematical calculation—it embodies the collective performance of America’s most established corporations. This stock market index tracks 30 large, publicly-owned blue-chip companies trading on the New York Stock Exchange (NYSE) and Nasdaq, serving as a proxy for broader economic health.

Charles Dow, co-founder of Dow, Jones & Company, created this index alongside his business partner Edward Jones in 1896. Their vision was revolutionary: provide investors with a simple, transparent measure of stock market performance during an era when financial information was scarce and often unreliable. The original index included just 12 industrial giants like General Electric and American Tobacco, representing the backbone of America’s rapidly industrializing economy.
Today, S&P Dow Jones Indices manages the DJIA through its Averages Committee, which carefully selects companies that best represent the modern American economy. This committee doesn’t follow rigid formulas but considers factors like company reputation, sustained growth history, and relevance to current economic trends. For those interested in financial services, understanding this selection process provides valuable insights into corporate stability and market leadership.
The index’s composition has evolved dramatically over the decades. While the original 12-stock average focused heavily on railroads, cotton, and oil companies, today’s DJIA includes technology giants like NVIDIA Corporation (NVDA), which replaced Intel in 2024, reflecting the growing importance of artificial intelligence and semiconductor technology in the modern economy.
The Dow Divisor: Mathematical Precision Behind Market Movements
The Dow Divisor represents one of the most ingenious solutions in financial mathematics, addressing a fundamental challenge that plagued early market indexes. When companies undergo stock splits, spin-offs, or other corporate actions, simple mathematical averages become distorted, creating false signals about market performance.
Charles Dow initially calculated his average by adding stock prices and dividing by the number of companies—a straightforward approach that worked until corporate actions disrupted the calculation. The Dow Divisor solved this problem by creating a flexible constant that adjusts automatically to maintain index continuity.
The current formula reads: DJIA Value = Σ (Component Stock Prices) ÷ Dow Divisor
As of 2024, the Dow Divisor stands at approximately 0.152, meaning every $1 change in any component stock moves the index by roughly 6.58 points. This seemingly small number carries enormous significance—it ensures that a stock split by Apple doesn’t artificially crash the entire index, while preserving over 125 years of historical data integrity.
Understanding this mechanism becomes crucial when analyzing DJIA stock price movements. A $10 increase in UnitedHealth Group’s stock price has the identical point impact on the index as a $10 increase in Coca-Cola’s stock, regardless of each company’s market capitalization or economic significance. This price-weighted methodology distinguishes the DJIA from market-cap-weighted indexes like the S&P 500.
For business professionals exploring digital transformation strategies, the Dow Divisor illustrates how mathematical innovations can solve complex real-world problems while maintaining historical continuity.
The Elite 30: Blue-Chip Powerhouses Driving the Index
The 30 companies comprising the DJIA today represent America’s most financially stable and influential corporations. These blue-chip companies aren’t necessarily the largest by market capitalization, but rather a curated selection of industry leaders that the Averages Committee believes best represents the diverse American economy.
Current DJIA components span multiple sectors, from technology and healthcare to finance and consumer goods. Recent additions like NVIDIA Corporation (NVDA) in 2024 highlight how the index adapts to reflect economic evolution. NVIDIA’s inclusion, replacing Intel, signals the growing importance of artificial intelligence and advanced semiconductors in driving economic growth.
The selection process prioritizes companies with strong reputations, consistent earnings, and broad economic relevance. Apple, Microsoft, and Johnson & Johnson exemplify these criteria—each commands significant market presence while maintaining the financial stability expected of Dow components. Meanwhile, companies are occasionally removed when their influence wanes or they face significant financial distress.
These changes aren’t arbitrary. When Amazon replaced Walgreens Boots Alliance in 2024, the committee recognized e-commerce’s fundamental role in modern consumer behavior. Such decisions reflect broader economic shifts while maintaining the index’s core purpose: providing a reliable barometer of American business health.
For entrepreneurs developing small business ideas, studying Dow components offers valuable lessons in building sustainable, scalable enterprises that can weather economic storms and maintain market leadership across decades.
Historical Milestones: Tracking American Economic Evolution
The DJIA chart tells the story of American economic history through numbers, capturing everything from the Great Depression’s depths to the dot-com boom’s heights. These milestones provide context for understanding how major events shape market psychology and long-term trends.
March 15, 1933 marked the index’s largest single-day percentage gain at 15.34%, occurring during the Great Depression’s recovery phase. This massive surge reflected desperate hope as markets began stabilizing after years of devastating losses. Conversely, October 19, 1987’s Black Monday saw the index plummet 22.61% in a single session, demonstrating how quickly market sentiment can shift.
More recent milestones include crossing 10,000 for the first time in March 1999 during the dot-com bubble, followed by the historic 30,000 level in November 2020 amid pandemic-driven monetary stimulus. The index’s breakthrough past 40,000 in May 2024 reflects continued economic resilience and corporate earnings growth.
These numbers aren’t mere statistics—they represent millions of investors’ hopes, fears, and financial decisions. The DJIA live ticker during the September 11, 2001 attacks showed how external shocks can temporarily derail market confidence, while subsequent recovery demonstrated the underlying strength of American enterprise.
For those tracking DJIA futures now or analyzing DJIA stock price today, understanding these historical patterns provides crucial context for interpreting current market movements and making informed investment decisions. Companies exploring goal setting for success can learn from how Dow components have navigated various economic cycles while maintaining long-term growth trajectories.
Investment Strategies: Accessing the Dow’s Performance
Investors cannot directly purchase the DJIA index, but several investment vehicles provide exposure to its 30 components. The most popular option is the SPDR Dow Jones Industrial Average ETF (DIA), nicknamed “Diamonds,” which tracks the index’s performance through a diversified portfolio of all constituent companies.
This ETF approach offers several advantages for investors seeking broad market exposure without the complexity of buying individual stocks. When you purchase DIA shares, you gain proportional ownership in all 30 blue-chip companies, from Apple and Microsoft to Coca-Cola and McDonald’s. The fund automatically rebalances when the index composition changes, ensuring your investment remains aligned with the official DJIA.
Alternative investment approaches include individual stock selection, focusing on specific Dow components that align with personal investment strategies. Some investors prefer this method to overweight particular sectors or companies they believe offer superior growth prospects. Others use index funds or mutual funds that track the Dow’s performance while potentially offering lower expense ratios than ETFs.
For institutional investors or those with substantial portfolios, futures contracts on the DJIA provide leverage and hedging opportunities. These derivatives allow sophisticated traders to speculate on index direction or protect existing positions against market volatility.
Understanding these investment vehicles becomes particularly important for professionals in warehouse management software for small business, as they often need to make informed decisions about company retirement plans or personal investment strategies while managing operational responsibilities.
Limitations and Modern Criticisms
Despite its historical significance and continued popularity, the DJIA faces substantial criticism from financial professionals who argue its methodology fails to accurately represent the modern American economy. These limitations stem primarily from its price-weighted structure and limited scope.
The most fundamental criticism involves the price-weighted methodology. A company’s influence on the index depends solely on its stock price, not its actual economic size or market value. This creates situations where a smaller company with a higher stock price can have greater index impact than a massive corporation with lower-priced shares. UnitedHealth Group, despite being smaller than Apple by market capitalization, historically wielded more influence over daily DJIA movements due to its higher share price.
The index’s narrow scope presents another significant limitation. With only 30 companies representing the entire U.S. economy, critics argue the DJIA cannot capture the full breadth of American business. The S&P 500, tracking 500 large-cap companies, provides much broader market representation and arguably offers a more accurate economic barometer.
Sector exclusions further limit the index’s representativeness. Transportation and utility companies are traditionally excluded from the DJIA, covered instead by separate Dow Jones averages. This means major economic players in these sectors don’t influence the main index, potentially skewing its economic representation.
The committee-based selection process introduces subjectivity that other indexes avoid. While the S&P 500 follows specific quantitative criteria for inclusion, DJIA changes depend on committee judgment, making the selection process less transparent and potentially more arbitrary.
For businesses exploring low-cost marketing ideas for startups, understanding these limitations helps contextualize market analysis and avoid overrelying on any single indicator when making business decisions.
DJIA vs. S&P 500: Choosing the Right Benchmark
The ongoing debate between DJIA and S&P 500 as market benchmarks reflects fundamental differences in methodology and scope. Understanding these distinctions helps investors and analysts choose appropriate indicators for their specific needs and objectives.
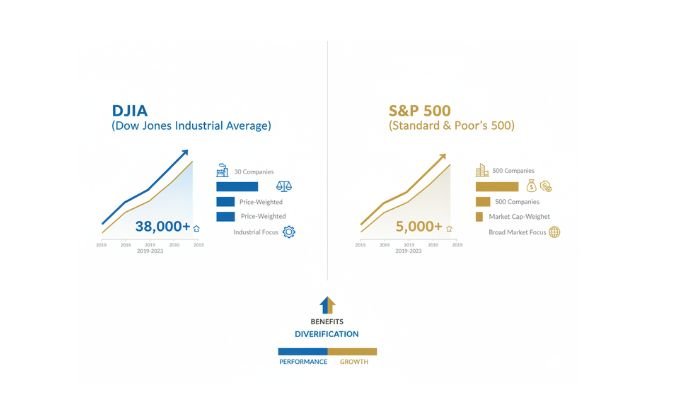
| Feature | DJIA | S&P 500 |
|---|---|---|
| Number of Companies | 30 | 500 |
| Weighting Method | Price-weighted | Market-cap weighted |
| Market Coverage | ~25% of total market value | ~80% of total market value |
| Selection Process | Committee-based | Rules-based |
| Historical Data | Since 1896 | Since 1957 |
| Best For | Historical analysis, media headlines | Broad market representation |
The S&P 500’s market-cap weighting means larger companies have proportionally greater influence, which many analysts consider more economically representative. Apple’s massive market capitalization gives it significant S&P 500 influence, reflecting its actual economic importance. In contrast, the DJIA’s price-weighting might give a smaller, higher-priced company disproportionate influence.
Broader representation makes the S&P 500 more suitable for comprehensive market analysis. Its 500 companies span all major sectors and include mid-cap companies alongside large-cap giants, providing a more complete picture of American business performance.
However, the DJIA’s historical continuity offers unique value for long-term analysis. With over 125 years of data, researchers can track American economic evolution through periods when the S&P 500 didn’t exist. This historical depth makes the DJIA irreplaceable for studying long-term market cycles and economic trends.
For businesses implementing ERP for small business solutions, understanding both indexes helps create more comprehensive market analysis and financial reporting capabilities.
Technology’s Role in Modern DJIA Tracking
Modern technology has revolutionized how investors access and analyze DJIA information, transforming what was once a daily newspaper calculation into real-time, global market intelligence. Today’s DJIA live ticker provides instant updates, while sophisticated analytical tools help investors understand market movements in unprecedented detail.
Real-time data streaming allows investors worldwide to track DJIA now movements second by second. Financial platforms like Bloomberg, Yahoo Finance, and specialized trading applications provide comprehensive dashboards showing current values, daily changes, historical charts, and component stock performance. This instant access enables more responsive investment decisions and better risk management.
Mobile technology has democratized DJIA access, putting professional-grade market information in every investor’s pocket. Smartphone apps deliver push notifications for significant market moves, while mobile-optimized charting tools allow detailed analysis from anywhere. This accessibility has contributed to increased retail investor participation in index-based investing.
Artificial intelligence and machine learning increasingly influence how analysts interpret DJIA data. Sophisticated algorithms can identify patterns in historical DJIA chart data that human analysts might miss, while predictive models attempt to forecast future movements based on economic indicators and market sentiment.
Social media integration has created new dynamics around DJIA coverage. Financial news breaks on Twitter faster than traditional media, while sentiment analysis tools monitor social platforms to gauge market mood and potential volatility. This real-time sentiment data provides additional context for understanding market movements beyond traditional financial metrics.
For companies developing best e-commerce business ideas for beginners, leveraging these technological tools can provide valuable market insights while building customer-facing applications that require real-time financial data integration.

Economic Indicators and DJIA Correlation
The DJIA’s relationship with broader economic indicators provides valuable insights for investors seeking to understand market movements within larger economic contexts. While the index reflects corporate performance, its movements often correlate with key economic metrics that signal overall economic health.
Employment data significantly influences DJIA performance, as job growth indicates consumer spending power and business confidence. Strong employment reports often drive index gains, while unemployment spikes typically correlate with market declines. The monthly jobs report from the Bureau of Labor Statistics consistently moves markets, with DJIA futures often gapping up or down following release.
Federal Reserve policy creates some of the most significant DJIA movements. Interest rate decisions affect corporate borrowing costs and investment attractiveness relative to bonds. When the Fed raises rates, stock markets often decline as bonds become more attractive; when rates fall, equity markets typically benefit. The DJIA’s blue-chip companies are particularly sensitive to these changes due to their substantial debt levels and financing needs.
GDP growth provides context for DJIA performance over longer periods. Strong economic growth typically supports higher corporate earnings, driving stock prices higher. Conversely, economic contractions often precede or coincide with market declines as investors anticipate reduced corporate profitability.
Inflation data creates complex relationships with DJIA performance. Moderate inflation often signals healthy economic growth, supporting stock prices. However, excessive inflation can hurt corporate margins and prompt Federal Reserve intervention, creating market volatility. The Consumer Price Index (CPI) releases consistently generate significant market reactions.
Understanding these relationships helps businesses exploring what is a business make more informed decisions about timing, financing, and strategic planning by contextualizing market movements within broader economic trends.
Global Impact and International Perspectives
The DJIA’s influence extends far beyond American borders, serving as a key indicator for global markets and international investment flows. When U.S. markets open with significant DJIA movements, Asian and European markets often react, demonstrating the index’s worldwide significance.
International investors closely monitor DJIA performance when making global portfolio allocation decisions. Strong DJIA performance often attracts foreign capital to U.S. markets, strengthening the dollar and influencing currency markets worldwide. Conversely, DJIA weakness can trigger capital flight from U.S. assets, affecting global financial stability.
Multinational corporations within the DJIA generate substantial revenue from international operations, making the index sensitive to global economic conditions. Companies like Coca-Cola, McDonald’s, and Apple derive significant income from overseas markets, so international economic developments directly impact their stock prices and, consequently, the DJIA.
Currency fluctuations affect DJIA components differently, creating complex relationships between exchange rates and index performance. A strong dollar helps companies that import raw materials but hurts those relying heavily on export sales. These currency effects can create divergent performance within DJIA components during periods of significant exchange rate volatility.
Geopolitical events consistently influence DJIA performance, with international conflicts, trade disputes, and diplomatic tensions creating market volatility. The index’s reaction to global events provides insight into how American businesses and investors perceive international risks and opportunities.
For enterprises considering Amazon business strategies or other international expansion opportunities, understanding the DJIA’s global connections helps assess how domestic market conditions might affect international business ventures.
Future Evolution and Emerging Trends
The DJIA continues evolving to reflect America’s changing economic landscape, with recent additions like NVIDIA Corporation demonstrating how technological advancement drives index composition changes. Looking ahead, several trends will likely shape the index’s future development and relevance.
Technology sector growth will probably drive additional changes in DJIA composition. As artificial intelligence, cloud computing, and digital transformation reshape the economy, traditional industrial companies may give way to technology leaders. The committee must balance maintaining the index’s industrial heritage with reflecting modern economic realities.
Sustainability considerations increasingly influence corporate performance and investor preferences. Environmental, Social, and Governance (ESG) factors may become more important in DJIA component selection as companies face pressure to demonstrate responsible business practices. This trend could favor companies with strong sustainability credentials while pressuring those with poor environmental records.
Cryptocurrency and digital assets present interesting challenges for traditional indexes like the DJIA. While direct cryptocurrency exposure seems unlikely, companies with significant digital asset operations or blockchain technology focus might gain consideration for index inclusion as these markets mature.
Healthcare and biotechnology advancement continues creating investment opportunities, with aging demographics driving demand for medical innovation. The DJIA’s healthcare representation through companies like Johnson & Johnson may expand as this sector grows in economic importance.
Global supply chain evolution affects many DJIA components, particularly manufacturers and retailers. Companies demonstrating resilience and adaptability in managing international supply chains may gain competitive advantages that influence their index weighting and performance.
For professionals developing digital transformation strategies, monitoring these DJIA evolution trends provides valuable insights into how established corporations adapt to technological change while maintaining market leadership.
Practical Applications for Modern Investors
Understanding the DJIA provides practical benefits beyond academic knowledge, offering concrete tools for investment decision-making, risk management, and portfolio construction. Modern investors can leverage DJIA insights in several ways to enhance their financial strategies.
Benchmark comparison represents one of the most valuable applications. By comparing personal portfolio performance against DJIA returns, investors can assess whether their strategies are outperforming or underperforming this well-known standard. This comparison helps identify successful approaches and areas needing improvement.
Sector rotation strategies benefit from DJIA analysis, as the index’s sector representation provides insights into which industries are gaining or losing favor. When technology stocks within the DJIA consistently outperform traditional industrials, it may signal broader sector rotation opportunities in the wider market.
Risk assessment improves through DJIA volatility analysis. During periods of high DJIA volatility, investors might reduce portfolio risk or increase cash positions. Conversely, low volatility periods might present opportunities for more aggressive investment strategies.
Economic cycle timing becomes more effective with DJIA historical analysis. Understanding how the index performed during previous recessions, expansions, and market cycles helps investors prepare for similar future conditions. This historical context supports better timing decisions for major portfolio changes.
Dollar-cost averaging strategies work particularly well with DJIA-based investments due to the index’s long-term upward trend and broad diversification. Regular investments in DIA or similar funds can help investors build wealth over time while minimizing the impact of market timing mistakes.
These practical applications support various business objectives, from personal wealth building to corporate treasury management, making DJIA knowledge valuable across different professional contexts. For businesses exploring Mumbai Times business insights, understanding market indicators like the DJIA enhances strategic decision-making capabilities.
Frequently Asked Questions
What exactly does the Dow Jones Industrial Average measure?
The DJIA tracks the stock price performance of 30 large, established U.S. companies across various industries. It serves as a barometer for the overall health of the U.S. stock market and economy.
How is the DJIA different from other stock market indexes?
Unlike market-cap-weighted indexes like the S&P 500, the DJIA uses price-weighting, meaning companies with higher stock prices have more influence regardless of their actual size or market value.
Can individual investors buy the Dow Jones directly?
No, you cannot buy the index directly. However, you can invest in ETFs like DIA (SPDR Dow Jones Industrial Average ETF) that track the DJIA’s performance.
Why does the DJIA only include 30 companies?
The 30-company limit maintains the index’s focus on the most significant, established corporations while ensuring it remains manageable and representative of major economic sectors.
How often does the DJIA composition change?
Changes occur infrequently, typically only when companies merge, face financial distress, or when the committee decides another company better represents the modern economy. There have been only 53 changes since 1896.
What causes the biggest DJIA movements?
Major movements typically result from economic news (employment data, Federal Reserve decisions), geopolitical events, corporate earnings reports, or significant changes in market sentiment.
How does the Dow Divisor work in practice?
The Dow Divisor (currently about 0.152) ensures that corporate actions like stock splits don’t artificially affect the index value. Every $1 change in any component stock moves the DJIA by approximately 6.58 points.
Mastering Market Intelligence Through the DJIA
The Dow Jones Industrial Average remains an indispensable tool for understanding American market dynamics and economic trends. While critics rightfully point to limitations in its price-weighted methodology and narrow scope, the DJIA’s historical significance, media prominence, and continued relevance to major institutional decisions ensure its enduring importance.
Success in modern investing requires understanding multiple market indicators, and the DJIA provides crucial context that complements broader market analysis. Whether you’re tracking DJIA stock price today, analyzing DJIA futures now, or studying long-term DJIA chart patterns, this knowledge enhances investment decision-making and market comprehension.
The index’s evolution from a 12-stock industrial average to today’s diverse collection of blue-chip companies reflects America’s economic transformation. As technology continues reshaping business landscapes and new challenges emerge, the DJIA will undoubtedly continue adapting while maintaining its core mission: providing investors with a reliable measure of American corporate performance.
For those ready to deepen their market knowledge, consider exploring additional resources at LinkLuminous for comprehensive investment education and market analysis tools that complement your DJIA understanding.